Winners/losers in Oakland’s Christmas Bird Count
By Bob Lewis
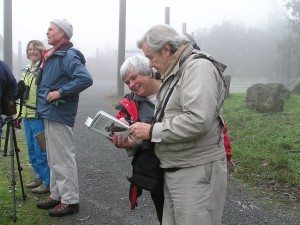
This year will be the 113th year of Christmas Bird Counts in North America. Golden Gate Bird Alliance sponsors two counts in our region, centered in San Francisco and Oakland. Although Christmas counts are great fun and an opportunity to meet other birders, see a variety of birds and get a good understanding of what birds are available in our area, they also have a more serious side.
The National Audubon Society has made the results of all counts available to everyone at www.audubon.org/bird/cbc/hr/index.html. This Citizen Science data is used by environmentalists and ornithologists to understand population changes, and consider actions that might help to minimize the loss of endangered species.
Recently I took a look at data from the Oakland Count to see what it might say.
For a variety of reasons, it was easy for me to look at the data from 1974 to 2011. This is a 38-year period. I divided it in half, and compared the years 1974-1993 with 1994-2011. Over this period, the population of Alameda County increased over 40 percent. Another development that potentially affected bird populations was the Oakland Hills fire in 1991, just before the beginning of the second period.
I averaged the count data over each period, and applied some statistical tests to the results. Here’s what I found, for the top 20 increases and decreases:
|
Birds with increasing populations |
Birds with decreasing populations |
||||
|
Species |
% incr. |
Avg(1) |
Species |
% decr. |
Avg(2) |
| Common Raven |
1258 |
146 |
White-winged Scoter |
95 |
199 |
| Red-shouldered Hawk |
978 |
29 |
Bonaparte’s Gull |
94 |
164 |
| Pygmy Nuthatch |
362 |
95 |
Northern Pintail |
90 |
1599 |
| American Crow |
302 |
386 |
Red Knot |
88 |
117 |
| Common Merganser |
276 |
87 |
Horned Lark |
87 |
45 |
| Hairy Woodpecker |
222 |
23 |
Pine Siskin |
84 |
891 |
| Black Phoebe |
177 |
186 |
Ruddy Turnstone |
77 |
22 |
| Townsend’s Warbler |
171 |
125 |
California Quail |
77 |
432 |
| Greater Yellowlegs |
158 |
60 |
Glaucous-winged Gull |
76 |
1386 |
| Black-necked Stilt |
121 |
162 |
Loggerhead Shrike |
75 |
26 |
| Wood Duck |
116 |
17 |
Brandt’s Cormorant |
74 |
107 |
| Cinnamon Teal |
110 |
40 |
Red-throated Loon |
72 |
44 |
| Marsh Wren |
99 |
10 |
American Pipit |
68 |
196 |
| Acorn Woodpecker |
97 |
39 |
Canvasback |
65 |
1356 |
| Nuttall’s Woodpecker |
85 |
88 |
European Starling |
64 |
6154 |
| Rock Pigeon |
78 |
2124 |
Wilson’s Snipe |
63 |
33 |
| Gadwall |
76 |
152 |
Wrentit |
60 |
445 |
| Bufflehead |
65 |
2093 |
Brewer’s Blackbird |
60 |
1805 |
| Brown Creeper |
55 |
74 |
Burrowing Owl |
58 |
10 |
| Turkey Vulture |
37 |
183 |
Red-breasted Merganser |
57 |
90 |
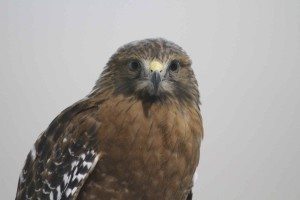
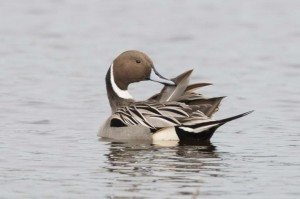
Keep in mind that statistical figures can be misleading. The Red-shouldered Hawk increase of almost 1,000 percent reflected an increase of two dozen individuals – from about three during the first period to 29 during the second period. (That is still a significant increase for hawks, which require a lot of territory.) The Northern Pintail reduction of 90 percent, on the other hand, reflected a decline from an average of 1,599 to 153.
Percentages can mean different things, depending on whether you’re talking about increases or reductions: Going from 10 to 20 birds is a 100 percent increase, while going from 20 to 10 birds is a 50 percent reduction.
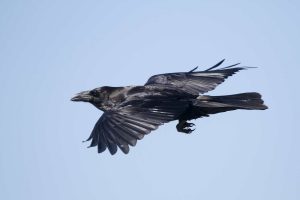
Each entry in the table provokes a question – why the change? Ravens and Crows, two of the species with the greatest increase, are attracted to human refuse as scavengers. Perhaps our increasing population is part of the cause.
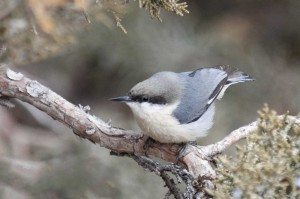
Pygmy Nuthatches were uncommon in most of the count circle until after the Oakland fire, when roasted pine cones provided a food source. They came and stayed. Nuttall’s, Acorn and Hairy Woodpeckers have all increased. Buffleheads are now one of the most common winter ducks on the bay, while Surf Scoters, which didn’t quite make the table, have declined 52 percent and scaup species by 38 percent. More recent years show sharper declines.
California Quail and Wrentits have declined markedly, as has acreage of chaparral, their preferred habitat. The decline in Northern Pintail mirrors the nationwide drop in this species, perhaps due to loss in breeding habitat.
One Christmas Count data set does not provide enough data for many conclusions, but coupled with data from many counts, stories of success and worry begin to emerge. The data is available because we have volunteers in the field every year, adding to our knowledge. It’s getting close to count time! The signup forms will become available on the GGBA web page in the second half of October.
Won’t you join us? Sign up as a feeder watcher if you’re not able to spend the day in the field – it only takes a little time to check your feeder to see what’s coming, and it’s fun to do.
Oakland’s CBC will be on Sunday December 16th. San Francisco’s will be held on Thursday December 27th.
Sign up on the GGBA web site at https://goldengatebirdalliance.org/birding-resources/christmas-bird-counts/.
